
Physical and biogeochemical controls of the phytoplankton blooms in North Western Mediterranean Sea: a multiplatform approach over a complete annual cycle (2012-2013 DEWEX experiment)
N. Mayot1, F. D’Ortenzio1, V. Taillandier1, L. Prieur1, O. Pasqueron de Fommervault1, H. Claustre1, A. Bosse2, P. Testor2 and P. Conan3
- Sorbonne Universités, UPMC Univ Paris 06, INSU-CNRS, Laboratoire d’Océanographie de Villefranche (LOV), 181 Chemin du Lazaret, 06230 Villefranche-sur-mer, France
- Sorbonne Universités, UPMC Univ Paris 06, CNRS-IRD-MNHN, Laboratoire d’Océanographie et du Climat : Expérimentation et Approches Numériques (LOCEAN), IPSL, 75252 Paris, France
- Sorbonne Universités, UPMC Univ Paris 06, CNRS, Laboratoire d’Océanographie Microbienne (LOMIC), Observatoire Océanologique, 66650 Banyuls-sur-mer, France
Download Article on JGR: Oceans website
During the DEWEX experiment, a large observation activity has been carried out in the North Western Mediterranean Sea (NWM) over an annual cycle (between July 2012 and July 2013). The DEWEX experiment could be considered very innovative because the data collected by five ship surveys was completed by autonomous platforms equipped with biogeochemical sensors (i.e. bio-optical gliders, Argo and BGC-Argo floats).
In the present manuscript, the in situ observations of DEWEX were combined with satellite ocean color data for an interpretation into a larger and consistent spatio-temporal context. The proposed contextualization of in situ data provides a suitable framework to investigate and discuss the existing theories on the onset of phytoplankton blooms in temperate seas. The results obtained in this area of the Mediterranean are certainly instructive for other oceanic regions characterized by temperate regimes.
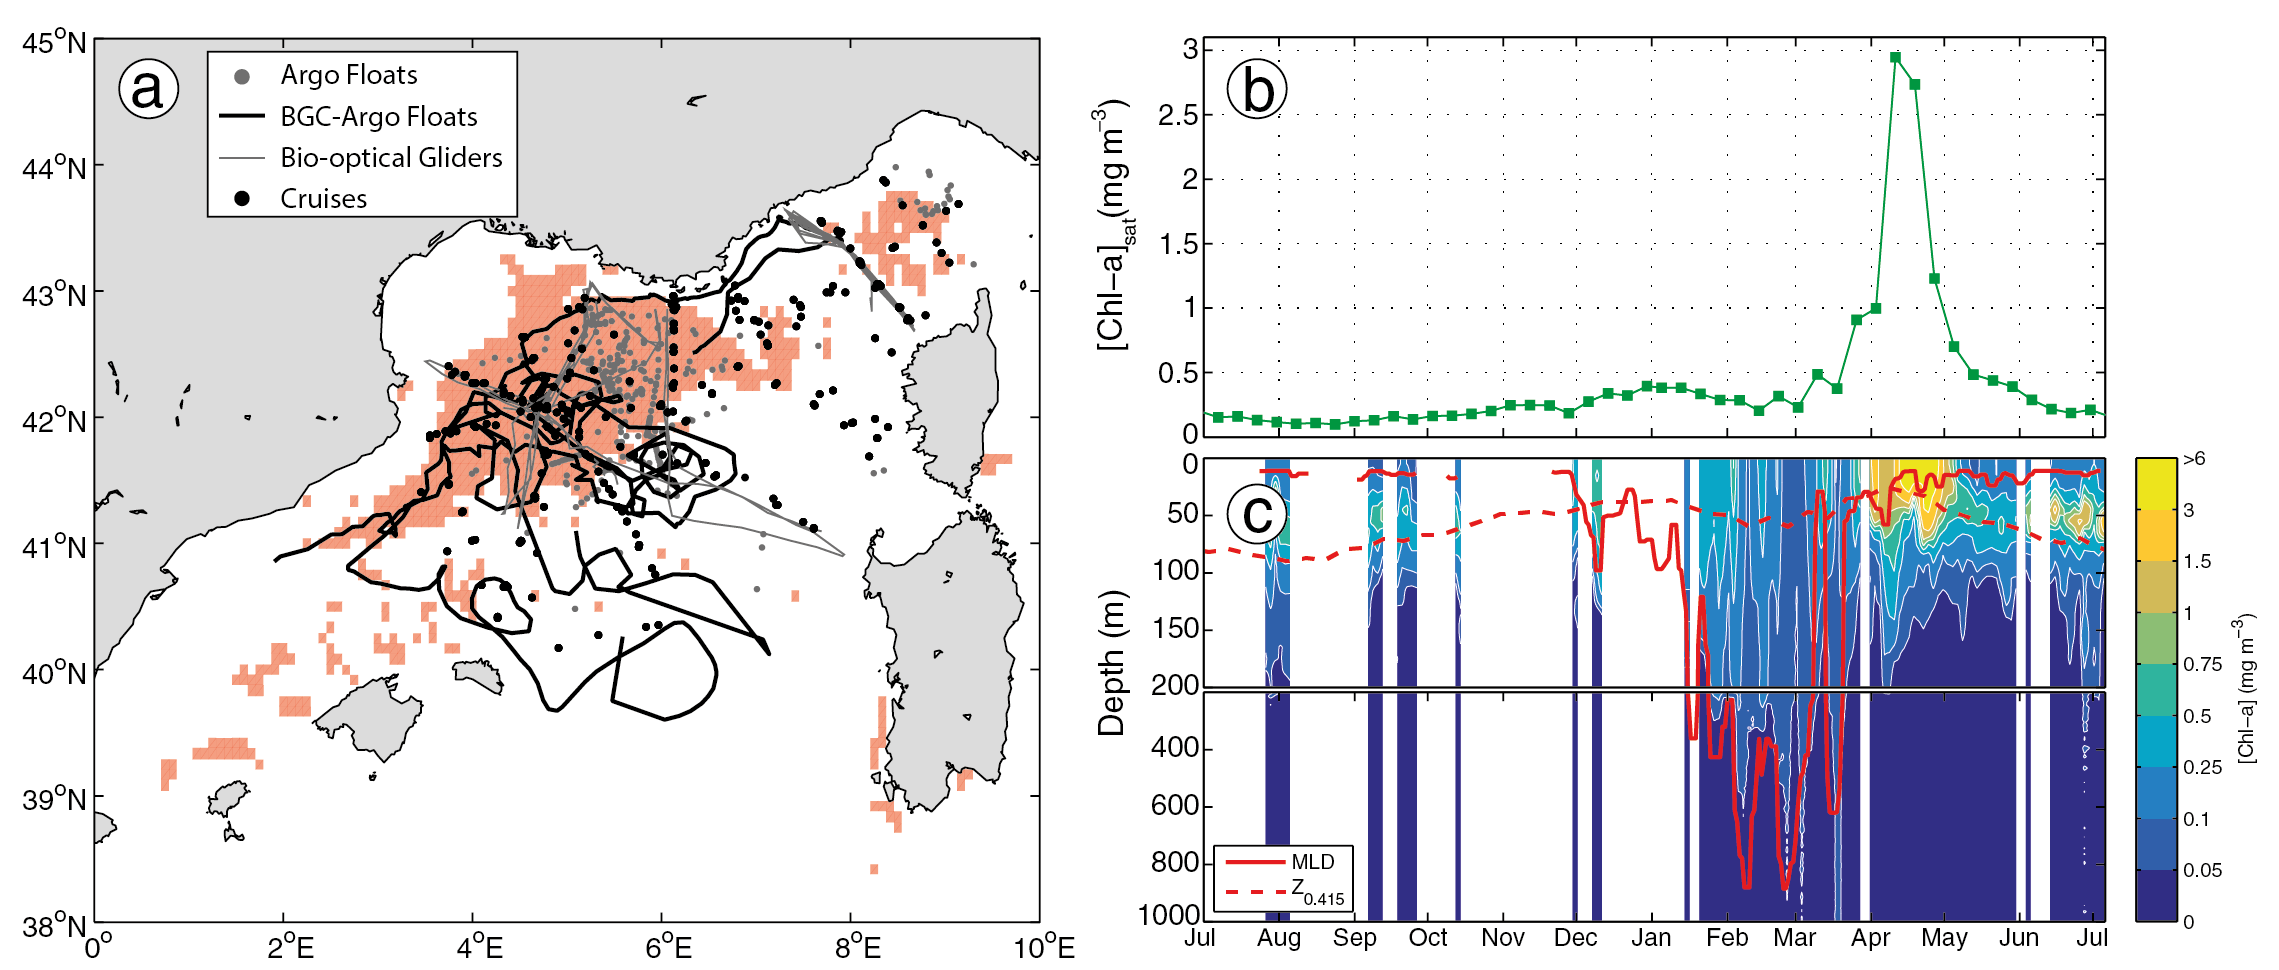
Figure Time series between July 2012 and July 2013 of physical and biogeochemical properties in an area in the northwestern Mediterranean Sea. (a) Positions of the profiles performed by the different sampling platforms, with the spatial distribution (in red) of the area determined by satellite. (b) Mean time-series of the chlorophyll-a concentration ([Chl-a]) as determined by satellite (MODIS Aqua). (c) The [Chl-a] from in situ chlorophyll fluorescence data. The solid red line represents the Mixed Layer Depth (MLD), and the dashed red line the isolume 0.415 E m-2 s-1 (Z0.415).