
Interannual variability of the Mediterranean trophic regimes from ocean color satellites
N. Mayot1, F. D’Ortenzio1, M. Ribera d’Alcalà2, H. Lavigne3, and H. Claustre1
- Sorbonne Universités, UPMC Univ Paris 06, INSU-CNRS, Laboratoire d’Océanographie de Villefranche (LOV), 181 Chemin du Lazaret, 06230 Villefranche-sur-mer, France
- Laboratorio di Oceanografia Biologica, Stazione Zoologica “A. Dohrn”, Villa Comunale, 80121 Napoli, Italy
- Istituto Nazionale di Oceanografia e di Geofisica Sperimentale (OGS), Borgo Grotta Gigante 42/c, 34010 Sgonico, Trieste, Italy
The present manuscript provides a reappraisal of the paper “On the trophic regimes of the Mediterranean Sea: a satellite analysis” by D’Ortenzio and Ribera d’Alcalà (2009), published in Biogeosciences. The D’Ortenzio and Ribera d’Alcalà paper (DR09) presented a bioregionalization of the Mediterranean Sea, based on the phytoplankton phenology retrieved from ocean color data. It had an important impact, both for the statistical method used and for its success in providing a synthetic description of the trophic regimes present in the Mediterranean Sea.
In our recently published manuscript (Mayot et al., 2016, Biogeosciences), we re-evaluate the approach presented in the DR09 paper by adding seven years of ocean color data and, more importantly, by analyzing the interannual variability of the Mediterranean trophic regimes, which was not considered in the DR09 study. Additionally, new trophic regimes were identified, with seasonal cycles of phytoplankton biomass different from the DR09 description.
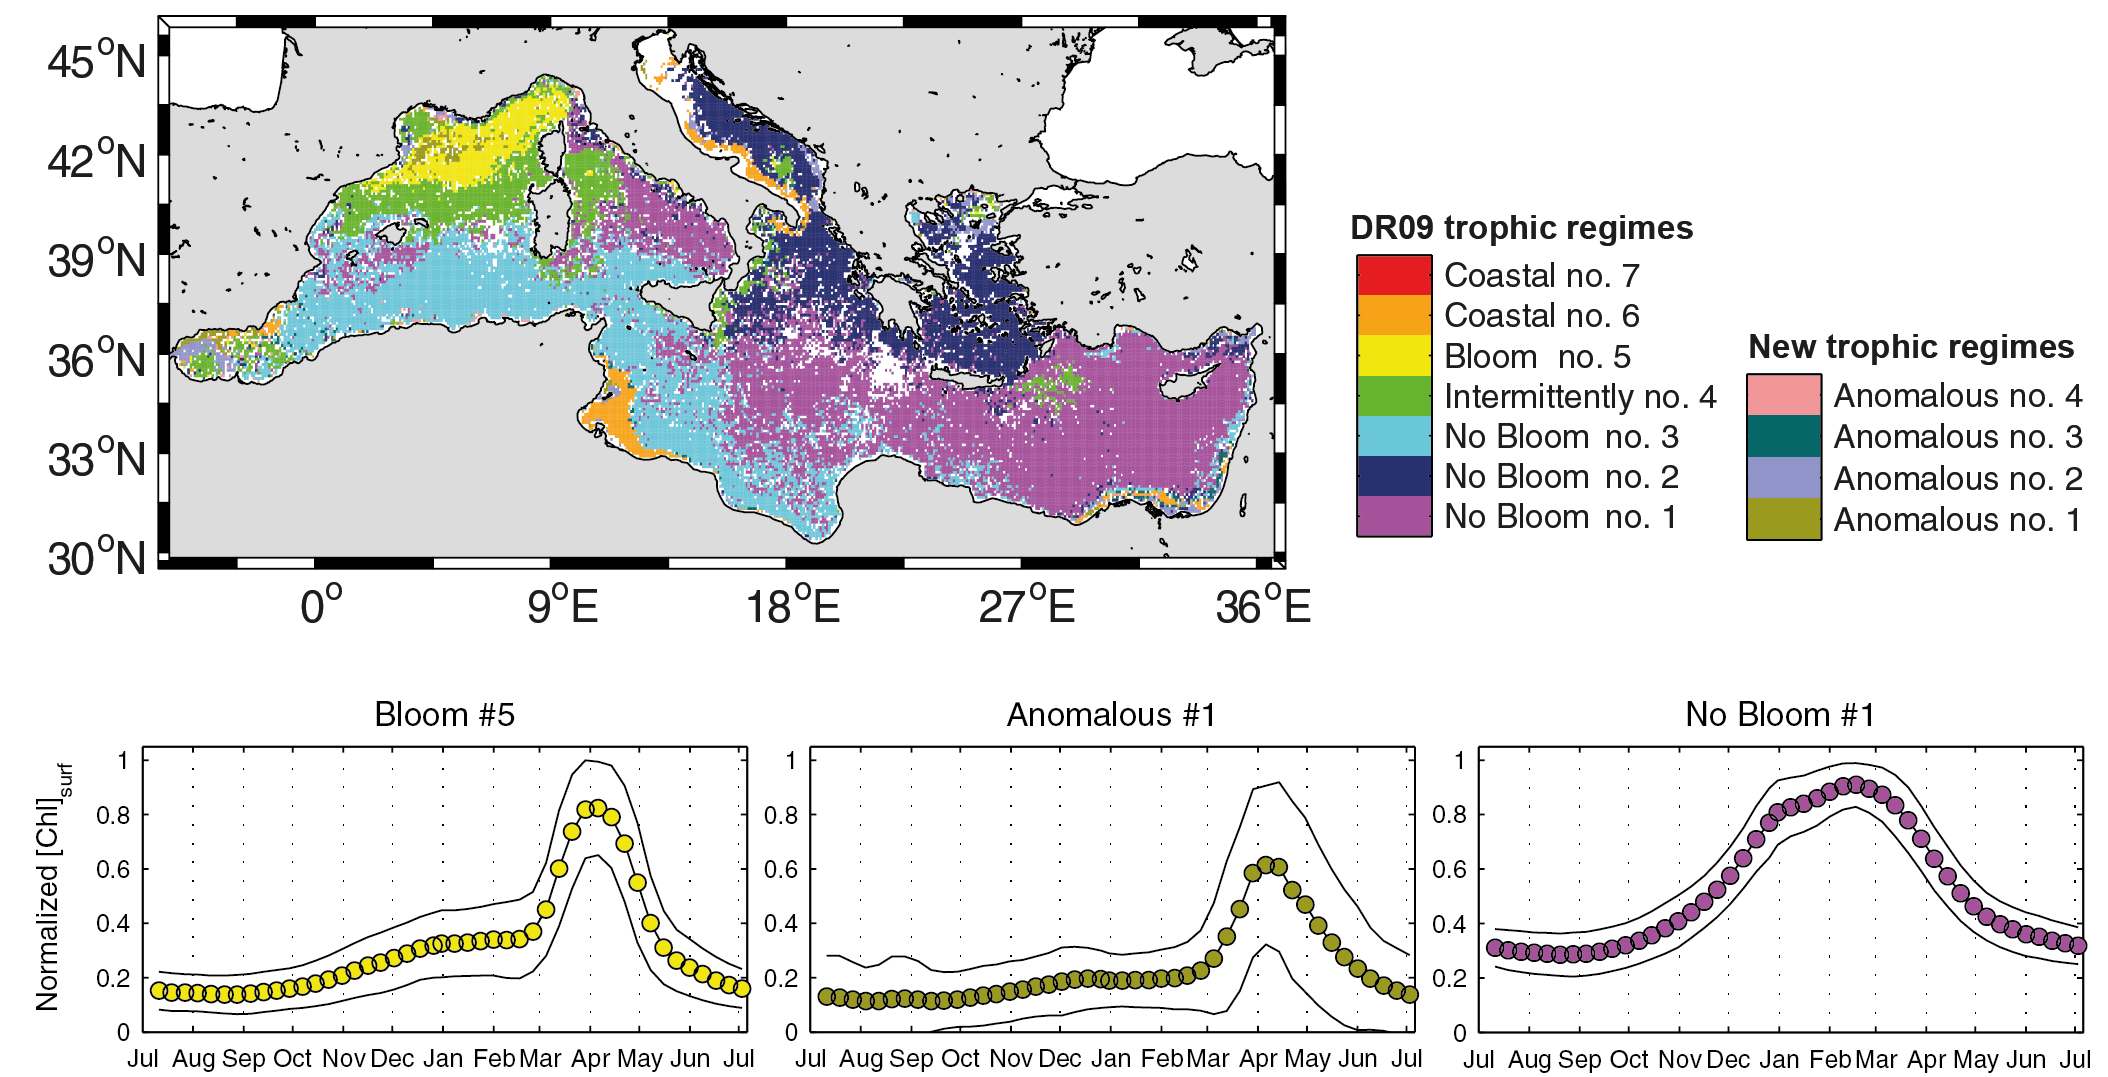
Over the 16 years studied, the seven trophic regimes identified by DR09 were the most recurrent. In fact, the patterns in the seasonality of the phytoplankton described by DR09 were always recovered. The mean spatial distribution of these trophic regimes (i.e. bioregions) was also similar to the one proposed by DR09 (figure 1). However, important interannual variabilities at regional scale in their spatial distribution, and in the emergence of new trophic regimes (i.e. Anomalous), were also highlighted and related to environmental factors: winter deep convection events, frontal instabilities, inflow of Atlantic or Black Sea Waters and river run-off. The Mediterranean Sea is thus confirmed to be a basin showing a large variety of phenological conditions in a very narrow latitudinal range.
All these results demonstrate that a bioregionalization based on the analysis of phenological patterns, as the one proposed here, provides a robust framework to identify the evolution of an oceanic area and to summarize the huge quantity of information that the satellite data offer. The utilization of this remote sensing data, in the framework of bioregions, in strong combination with in-situ data, should help to understand the underlying mechanisms of the phytoplankton dynamics in the Mediterranean Sea.
The 16 annual maps can be freely downloaded (.txt files) from the links below, with the longitudes and latitudes associated. The numbers and colors (in [R,G,B]) associated to the bioregions are:
| No Bloom-1 | No Bloom-2 | No Bloom-3 | Intermediate-4 | Bloom-5 | Coastal-6 | Coastal-7 | Anomalous-1 | Anomalous-2 | Anomalous-3 | Anomalous-4 |
| Nb. 1 | Nb. 2 | Nb. 3 | Nb. 4 | Nb. 5 | Nb. 6 | Nb. 7 | Nb. 8 | Nb. 9 | Nb. 10 | Nb. 11 |
| [1, 0, 1] | [0, 0, 0.55] | [0, 1, 1] | [0, 1, 0] | [1, 1, 0] | [1, 0.65, 0] | [1, 0, 0] | [0.6, 0.6, 0] | [0.6, 0.6, 1] | [0, 0.4, 0.4] | [1, 0.6, 0.6] |
Download Maps
- Longitudes (°E)
- Latitudes (°N)
- July 1998 – July 1999
- July 1999 – July 2000
- July 2000 – July 2001
- July 2001 – July 2002
- July 2002 – July 2003
- July 2003 – July 2004
- July 2004 – July 2005
- July 2005 – July 2006
- July 2006 – July 2007
- July 2007 – July 2008
- July 2008 – July 2009
- July 2009 – July 2010
- July 2010 – July 2011
- July 2011 – July 2012
- July 2012 – July 2013
- July 2013 – July 2014
- Figure 5a
- Figure 8